For a larger picture click the thumbnails.
1. Two views of geological time

The sequence in which organisms first make their appearance is assumed to be an evolutionary one because it is interpreted as taking place over billions of years. The timescale determines the way the sequence is interpreted. However, as summarised by the diagrams, the sequence itself looks much more like one of pre-existing life gradually recovering from a global catastrophe and as such gives grounds for the timescale to be questioned.
 Earth’s rocks can be analysed into successive time zones, from the Quaternary down to the Archaean. The lowest division, the Hadean, is not represented by sedimentary rocks on Earth, though there is zircon evidence (ultra-hard crystals within younger sandstones) that land and water existed then. According to recolonisation theory, the cataclysm at the end of the Hadean initiated plate tectonics. Over time, the shattered pre-cataclysm surface – overwhelmed by water – was subducted into the mantle under new crust formed at the site of impact craters. Also shown are a few representatives of major animal groups at the point where they first appear. Diagram not to scale.
 The divisions of geological history in proportion to the time attributed to them. Left column: the radioisotope-based timescale, whereby almost all evolution is concentrated in the final sixth of life’s history. The compression appears particularly drastic in the Cenozoic, the divisions of which are too small to show separately and are therefore summarised as ‘Palaeogene’ (Palaeocene to the Oligocene) and ‘Neogene’ (Miocene to the present). Right: the same sequence on the basis that radioactivity was much higher in the past and progressively declined. The timescale is anchored to empirically derived values back to the Cretaceous, but otherwise remains tentative. Note that Cenozoic mammals appear much earlier in the sequence and the Precambrian is proportionally miniscule, though still a significant length of time in real terms.

The chart is taken from The International Commission on Stratigraphy (ICS) and gives some idea of how finely it is possible to subdivide geological time.

This image is a schematic representation of the first appearance and subsequent diversity of major groups of organisms. They show no evidence of being linked together in a single ‘tree of life’.

Graphs showing how the number of marine and terrestrial families has increased over time. The patterns are consistent with both evolution and recolonisation theory, but not with the idea that a Flood took place in the Palaeozoic and Mesozoic (which would predict a pattern of sharply decreasing diversity). Source: M. J. Benton, Diversification and extinction in the history of life, Science 268:52-58 (1995).

Chart showing a summary of the fossil record of insect orders, where spindle thickness corresponds to number of families at any one time. The membership of some orders is uncertain (e.g. ants may not be related to bees/wasps) but in general they are probably equivalent to the created ‘kinds’, their fossil record indicating an amazing pre-programmed capacity for variation. Of the 41 orders shown, 17 suddenly appear in the Carboniferous and a further 12 in the Permian. Estimates of the number of current insect species range from 5 million to 80 million. (C.C. Labandeira & G.J. Eble, Gondwana Alive: Biodiversity and the Evolving Biosphere (2005))
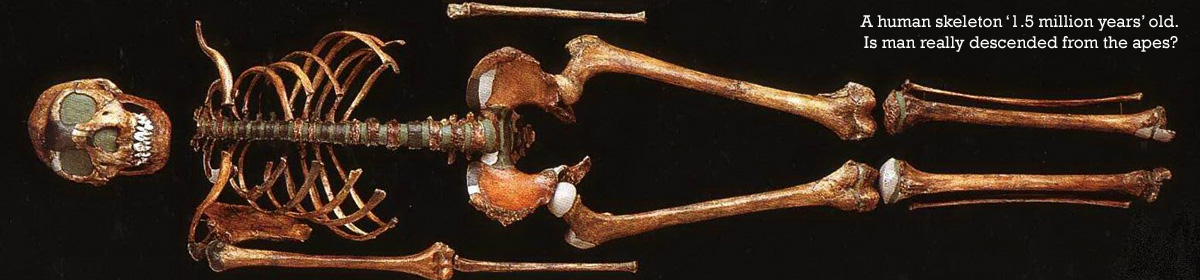
 The appearance of modern mammals is explosive. Evolutionary theory assumes that all are related to each other, but determining the relationships between one order and another has proved difficult. Few have a fossil record going back as far as the Cretaceous; the majority appear in the Early Eocene (in radioisotope chronology 55 million years ago). Moreover, evolutionary trees based on morphology (anatomy) differ radically from those based on molecular studies (genomes of living mammals). The former identify around 29 orders, the latter only 19. Apart from the patchiness of the fossil record, a major reason for the disagreement is that many features assumed in morphological studies to have evolved uniquely ‘evolved’ more than once, in parallel. Another major reason may be that mammal orders are not all related to each other. The fact that many features evolved in parallel in separate lineages, and did so in a coordinated fashion, according to their impact on other parts of the body, is evidence that they were genetically controlled. The evolution that occurred was pre-programmed. It was not inevitable, and we cannot assume it was limitless.

Alternating limestones and clays in the geological record usually reflect changes in climate. On the basis that the Earth is billions of years old, geologists attribute them to astronomical cycles that take 20,000 years or more to complete (known as ‘Milankovitch cycles’). However, the direct sedimentary evidence suggests that we should be thinking of the annual cycle of summer and winter.
The diagram shows the regular alternations of limestone and limey shale in the Greenhorn Formation, Colorado. The limestone derived mostly from marine plankton, the shale from terrestrial uplands, which were more intensely eroded during the winter owing to heavier rains. The cycles are approximately 1 metre thick, with burrowing increasing from bottom to top. Burrowing organisms can colonise a new surface in weeks and destroy all traces of bedding in months to years. Undisturbed or incompletely burrowed strata are common in the geological record.
 The standard geological timescale obtains its dates by radioisotope dating, but what if the underlying assumption of constant half-lives was invalid? It is certainly possible. The rate at which a radioactive element decays depends on the speed of light, so if the speed was faster in the past, the rate of radioactive decay would also have been faster. The diagram shows how critical the assumption of constant decay is. With higher ‘c’, radioisotope clocks tick faster, the processes that the clocks measure are faster, and the rates at which stars go through their cycles are faster. The chronology of the entire universe is affected.